ArangoDB v3.4 reached End of Life (EOL) and is no longer supported.
This documentation is outdated. Please see the most recent version here: Latest Docs
Dashboard
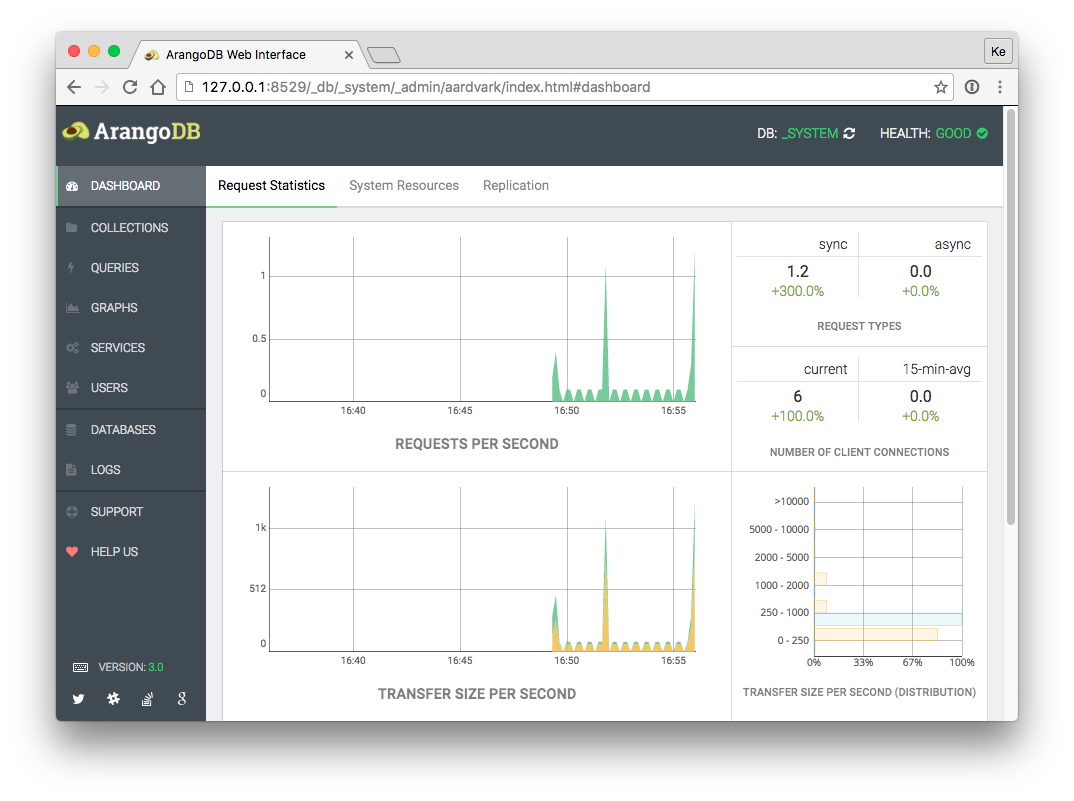
The Dashboard tab provides statistics which are polled regularly from the ArangoDB server.

Requests Statistics:
- Requests per second
- Request types
- Number of client connections
- Transfer size
- Transfer size (distribution)
- Average request time
- Average request time (distribution)
System Resources:
- Number of threads
- Memory
- Virtual size
- Major page faults
- Used CPU time
Replication:
- Replication state
- Totals
- Ticks
- Progress

